by Kenny Shirley
January 2014
January 12, 2014
The 2014 Baseball HOF voting results were announced on Wednesday, January 8th, and three players, Greg Maddux, Tom Glavine, and Frank Thomas, all of whom were first-ballot candidates, were elected, receiving votes on about 97%, 91%, and 83% of the 571 ballots. Our model's predictions were... a little off, to say the least. We got Maddux almost exactly right, but we completely whiffed on Thomas and Glavine (whom we predicted to get 64% and 53% of the vote, respectively). Details below in 3 sections:
            Name Year YoB  Percentage  Previous   Drop
1     Luis Tiant 1989   2        10.5      30.9  -20.4
2    Maury Wills 1982   5        21.9      40.6  -18.7
3      Lee Smith 2014  12        29.9      47.8  -17.9
4     Tony Oliva 1989   8        30.2      47.3  -17.1
5  Mickey Lolich 1989   5        10.5      25.5  -15.0
6    Jim Bunning 1979   3        34.0      47.8  -13.8
7   Harvey Kuenn 1989  13        25.7      39.3  -13.6
8       Jim Rice 1999   5        29.4      42.9  -13.5
9  Alan Trammell 2014  13        20.8      33.6  -12.8
10     Ken Boyer 1989  10        13.9      25.5  -11.6
The great thing about using only a player's career statistics to predict his HOF voting percentage is that we can make predictions for next year right away! Without further ado, here are our model's predictions for the 2015 HOF vote (using a projected ballot from baseball-reference.com, since the real ballot has not yet been finalized and released).
                Name Previous Predicted
1      Randy Johnson      0.0      99.7
2     Pedro Martinez      0.0      92.4
3        John Smoltz      0.0      71.5
4       Craig Biggio     74.8      69.3
5        Mike Piazza     62.2      59.3
6       Jeff Bagwell     54.3      51.4
7         Tim Raines     46.1      42.0
8      Roger Clemens     35.4      29.4
9        Barry Bonds     34.7      28.6
10         Lee Smith     29.9      23.5
11    Curt Schilling     29.2      22.7
12    Edgar Martinez     25.2      18.8
13     Alan Trammell     20.8      14.9
14      Mike Mussina     20.3      13.8
15 Nomar Garciaparra      0.0      11.2
16         Jeff Kent     15.2       9.9
17      Fred McGriff     11.7       8.7
18      Mark McGwire     11.0       8.3
19      Larry Walker     10.2       7.9
20     Don Mattingly      8.2       7.8
21        Sammy Sosa      7.2       6.5
22     Troy Percival      0.0       5.6
23    Carlos Delgado      0.0       2.9
24        Tom Gordon      0.0       1.4
25       Brian Giles      0.0       1.0
26      Darin Erstad      0.0       0.9
27    Gary Sheffield      0.0       0.6
28      Mark Loretta      0.0       0.6
29       Cliff Floyd      0.0       0.5
30      Jermaine Dye      0.0       0.5
31     Jason Schmidt      0.0       0.2
32      Rich Aurilia      0.0       0.2
33        Tony Clark      0.0       0.1
34         B.J. Ryan      0.0       0.1
35    Eddie Guardado      0.0       0.1
36   Jarrod Washburn      0.0       0.0
37    Kelvim Escobar      0.0       0.0
38         Paul Byrd      0.0       0.0
39         Joe Crede      0.0       0.0
40    David Weathers      0.0       0.0
41     Braden Looper      0.0       0.0
42    Julian Tavarez      0.0       0.0
43       Alan Embree      0.0       0.0
44       Ron Villone      0.0       0.0
How interesting! I think the top 3 predictions are pretty decent: everybody thinks Johnson and Martinez are shoo-ins, and I think the consensus is that Smoltz is closer to the 75% borderline (rather than being an automatic first-ballot guy). Because there are three strong first-ballot candidates, the predictions for all the rest of the returning candidates are lower than their 2014 results, which I think will not be accurate for Biggio -- he's almost sure to get in on his third ballot, in my opinion. I also expect Mussina's voting percentage to rise over the years.
The predictions for first-ballot players Nomar Garciaparra, Carlos Delgado, and Gary Sheffield are quite low -- especially Sheffield (less than 1%)! If I were to manually adjust the 2015 predictions for first-ballot players, I'd bump up the predictions for Sheffield and Delgado to around the 10%-20% range.
I'll come back throughout the year to post improvements to the model as I play around with it.
I should also acknowledge that I'm not the only person making HOF predictions. I've enjoyed reading the work of Bill Deane, Chris Jaffe, and Sean Lahman, among others.
Kenny Shirley
January 12, 2014
January 5, 2014
Last January, after the 2013 Baseball Hall of Fame voting results were announced, my colleague Carlos Scheidegger and I created an interactive visualization of historical Baseball Hall of Fame voting results, showing the voting trajectories of all the players who have been listed on the ballot since Hall of Fame voting began in 1936 (there were over 1000 of them). Our visualization allows you to filter on the career statistics of players ('HR > 400', or 'BA > .300 and SB > 200', for example) in order to display only a subset of the trajectories. This way you can interactively explore the way that various career accomplishments affect a player's Hall of Fame worthiness. It was a lot of fun to create, and we even got some recognition in December from Deadspin as one of the 12 best sports infographics of the year!
The logical next step, to me, was to see if we could predict future voting results based solely on a player's statistics. I started with a simple 'baseline' statistical model, and backtested it over the past 15-20 years to see how accurate its predictions were. Then, I made a series of refinements to the model to improve its predictive accuracy until I couldn't find any more ways to improve it (or until any potential improvements would have been too much work).
On this webpage I'll share the model's predictions for 2014 (the official results will be announced on January 8th, 2014), as well as the statistical modeling steps that I took to make them. The raw data and R code are available on my 'HOFmodel' github repo under 'HOFregression.csv' and 'RegressionModel.R', respectively. These probably aren't the most accurate possible predictions, since in real-world data analyses like this one there always seem to be a few special cases, and a few non-quantitative variables that can improve the predictive accuracy. But I think the analysis presented here comes close to the most accurate possible predictions that can be made using purely quantitative methods.
Without further ado, here are the model-based predictions for the 2014 Baseball Hall of Fame vote:
| Name | Position | Year on Ballot | 2013 % | 2014 Predicted % | 50% Interval | 95% Interval | |
|---|---|---|---|---|---|---|---|
| 1 | Greg Maddux | P | 1 | 97.40 | (96.8, 97.9) | (95.6, 98.9) | |
| 2 | Craig Biggio | 2B | 2 | 68.2 | 74.20 | (72.9, 75.4) | (70.3, 78.0) |
| 3 | Jack Morris | P | 15 | 67.7 | 70.80 | (69.4, 72.1) | (66.6, 74.3) |
| 4 | Mike Piazza | C | 2 | 57.8 | 64.30 | (62.7, 65.7) | (59.9, 68.5) |
| 5 | Frank Thomas | 1B | 1 | 64.10 | (61.9, 66.1) | (58.5, 69.2) | |
| 6 | Jeff Bagwell | 1B | 4 | 59.6 | 61.00 | (59.8, 62.6) | (57.1, 65.0) |
| 7 | Tom Glavine | P | 1 | 53.50 | (50.9, 56.4) | (45.9, 60.8) | |
| 8 | Tim Raines | LF | 7 | 52.2 | 53.40 | (51.8, 54.8) | (49.2, 57.5) |
| 9 | Lee Smith | P | 12 | 47.8 | 48.40 | (46.9, 49.6) | (44.1, 52.2) |
| 10 | Mike Mussina | P | 1 | 42.40 | (39.9, 44.8) | (35.1, 49.9) | |
| 11 | Curt Schilling | P | 2 | 38.8 | 39.20 | (37.6, 40.6) | (35.3, 43.2) |
| 12 | Roger Clemens | P | 2 | 37.6 | 37.40 | (36.0, 38.8) | (33.4, 41.7) |
| 13 | Barry Bonds | LF | 2 | 36.2 | 35.40 | (34.1, 36.7) | (31.5, 39.7) |
| 14 | Edgar Martinez | DH | 5 | 35.9 | 33.70 | (32.3, 35.0) | (29.7, 37.4) |
| 15 | Alan Trammell | SS | 13 | 33.6 | 30.90 | (29.5, 32.2) | (27.2, 35.0) |
| 16 | Larry Walker | RF | 4 | 21.6 | 17.90 | (16.9, 19.0) | (14.8, 20.9) |
| 17 | Fred McGriff | 1B | 5 | 20.7 | 17.10 | (16.0, 18.1) | (14.1, 20.0) |
| 18 | Mark McGwire | 1B | 8 | 16.9 | 13.80 | (12.8, 14.6) | (11.1, 16.5) |
| 19 | Don Mattingly | 1B | 14 | 13.2 | 11.10 | (10.2, 12.0) | (8.6, 13.7) |
| 20 | Sammy Sosa | RF | 2 | 12.5 | 9.60 | (8.8, 10.5) | (7.2, 11.8) |
| 21 | Luis Gonzalez | LF | 1 | 9.50 | (8.4, 10.4) | (6.7, 12.3) | |
| 22 | Moises Alou | LF | 1 | 8.80 | (7.9, 9.7) | (6.2, 11.6) | |
| 23 | Rafael Palmeiro | 1B | 4 | 8.8 | 8.40 | (7.6, 9.1) | (6.2, 10.5) |
| 24 | Jeff Kent | 2B | 1 | 5.20 | (4.4, 5.8) | (3.2, 7.2) | |
| 25 | Kenny Rogers | P | 1 | 2.50 | (1.9, 3.0) | (1.2, 4.0) | |
| 26 | Armando Benitez | P | 1 | 1.40 | (1.1, 1.8) | (0.5, 2.5) | |
| 27 | Sean Casey | 1B | 1 | 1.00 | (0.7, 1.2) | (0.2, 1.9) | |
| 28 | Ray Durham | 2B | 1 | 0.60 | (0.4, 0.7) | (0.0, 1.2) | |
| 29 | Eric Gagne | P | 1 | 0.30 | (0.2, 0.4) | (0.0, 0.9) | |
| 30 | J.T. Snow | 1B | 1 | 0.30 | (0.2, 0.4) | (0.0, 0.9) | |
| 31 | Todd Jones | P | 1 | 0.30 | (0.2, 0.5) | (0.0, 0.9) | |
| 32 | Hideo Nomo | P | 1 | 0.20 | (0.0, 0.2) | (0.0, 0.5) | |
| 33 | Richie Sexson | 1B | 1 | 0.20 | (0.0, 0.4) | (0.0, 0.5) | |
| 34 | Mike Timlin | P | 1 | 0.20 | (0.0, 0.4) | (0.0, 0.7) | |
| 35 | Paul Lo Duca | C | 1 | 0.10 | (0.0, 0.2) | (0.0, 0.4) | |
| 36 | Jacque Jones | RF | 1 | 0.10 | (0.0, 0.2) | (0.0, 0.4) |
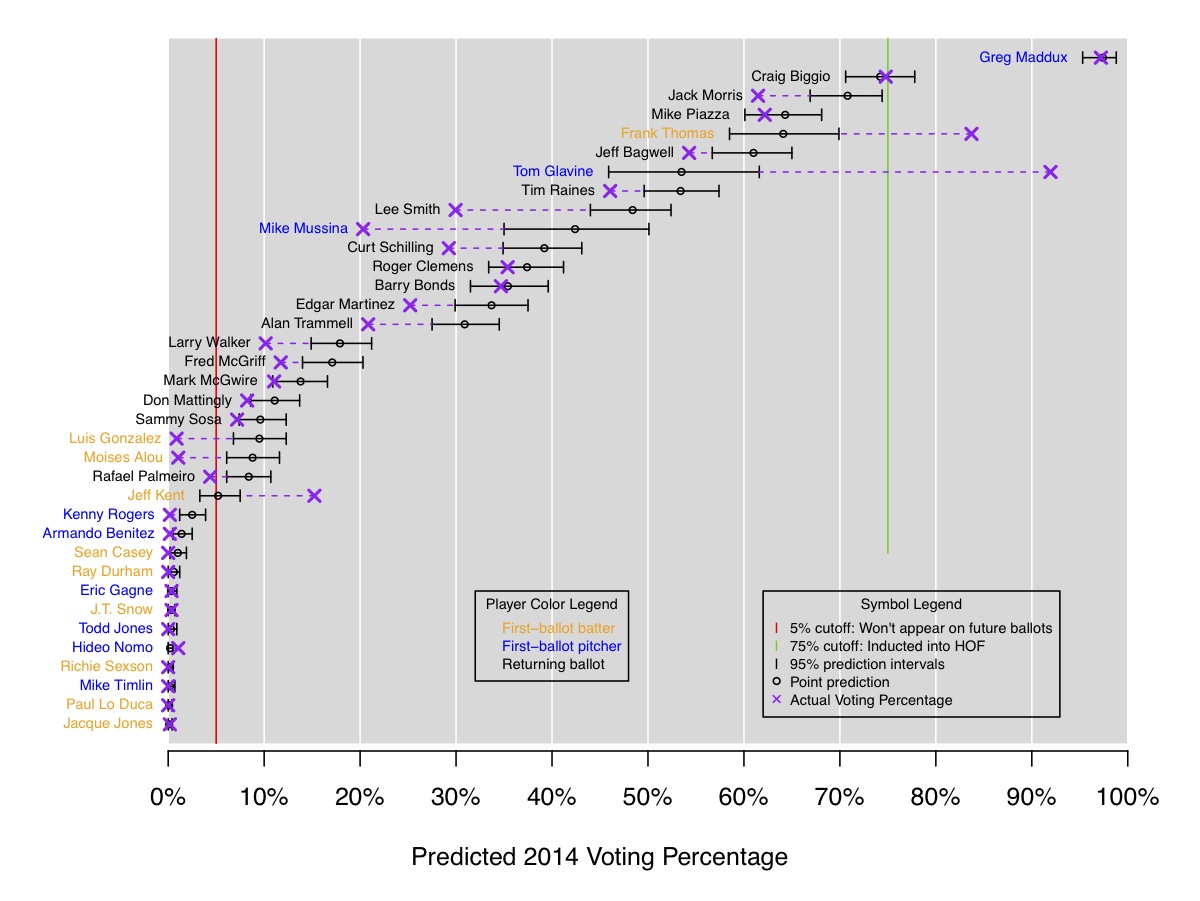
And in the figure below, the predictions are shown graphically, with 50% and 95% prediction intervals for each player:
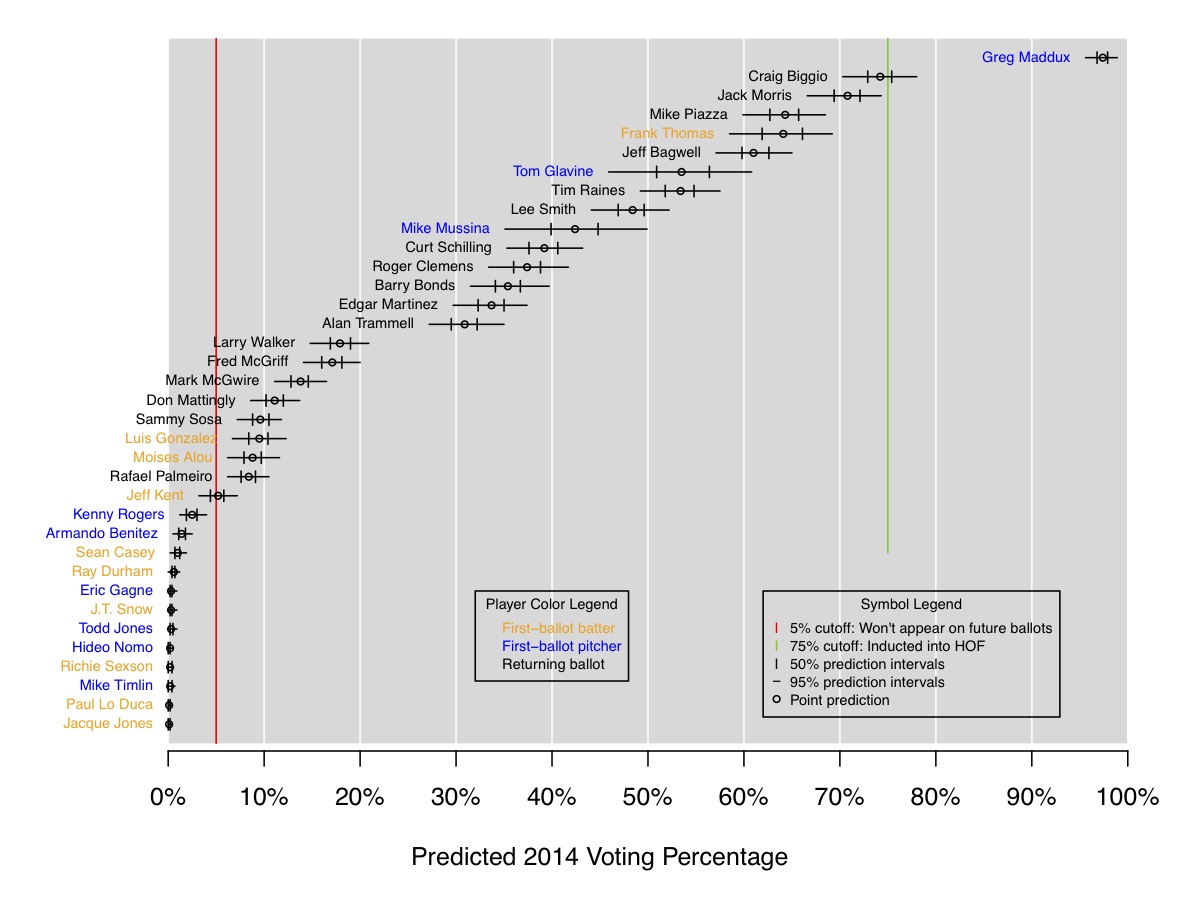
In a nutshell, the model predicts that Greg Maddux is a lock to be elected this year (with over 95% of the vote on his first time on the ballot), and second-year player Craig Biggio has about a 40% chance of being elected this year. As I'll describe below, the interval predictions here are probably too narrow, as was shown by backtesting the model over the past 17 years. I personally woudldn't be surprised if Frank Thomas and Tom Glavine are also inducted this year (in addition to Maddux and Biggio). But -- this isn't about my personal opinion: the goal here is to see how accurate we can be using just a statistical model based on past results.
The rest of this webpage contains:
We're going to attempt to predict who will get into the Baseball Hall of Fame this year using a statistical model based on past data. Specifically, we will predict exactly what percentage of the vote each of this year's 36 eligible players will receive, and we'll provide prediction intervals, to describe the uncertainty of our forecasts.
First, a quick review of the Baseball Hall of Fame (HOF) voting rules:
Who are the voters?
The voters are members of the Baseball Writers Association of America (BBWAA). The number of ballots sent out each year has grown slowly from about 300 ballots fifty years ago to about 600 ballots today. Each voter receives a ballot (where in a typical year about 40 eligible players are listed), and can select up to 10 players on his or her ballot that they think should be inducted into the Hall of Fame that year (but no more than 10). A voter can also return an empty ballot (selecting no players at all). In 2013, 569 ballots were returned.
Which players are eligible to be on the ballot?
Our idea is to fit statistical models to historical voting data to estimate the relationship between a player's career statistics and his Hall of Fame voting percentage in a given year (i.e. the percentage of returned ballots on which that player was selected). We'll fit two basic types of models:
The basic challenge in fitting both types of models will be to use the most relevant statistics that we can find, in order to explain as much variation in HOF voting as possible. An interesting question that this analysis will try to answer is "How much of a player's HOF voting percentage is related to his career statistics, and how much is related to other, harder-to-measure qualities, like his overall popularity, or any other unmeasurable qualities that influence voters?"
In the next few pages, we'll take you through our analysis, describing the progression of different statistical models that we used and explaining how we devised them. The measure of predictive accuracy that we will use is RMSE, which stands for "Root Mean Squared Error". It is probably the most common statistical measure of predictive accuracy. When we say that a particular statistical model has an RMSE of 10%, for example, in our context this means that our predictions of voting percentages are off by about 10% on average. This is an absolute error, not a relative error.
Since HOF voting began in 1936, there have been 1070 different players listed on the ballots, and through 2013, 107 of them have been inducted into the Hall of Fame by being selected on 75% or more of BBWAA ballots. The voting rules have changed somewhat since 1936, but have been relatively stable since 1967. So, for this analysis, we will only use data from players whose first appearance on the ballot occurred in 1967 or afterward, giving us 47 years worth of training data and 635 unique players in the data set (406 position players and 229 pitchers). Including multiple appearances on the ballot, the total number of player-years between 1967 and 2013 in which we observe a voting percentage is 1458 (an average of about 2.3 years on the ballot per player).
To measure our predictive accuracy for different models, we will make one-year-ahead predictions starting in 1997, and going through 2013. That is, using data from 1967-1996, we will fit a model and make predictions for the 1997 ballot. Then we'll update the model by training it on data from 1967-1997, and we'll make predictions for the 1998 ballot, and so on, through 2013. This will give us 17 years of out-of-sample, one-year-ahead predictions with which to measure the accuracy of our models. The choice to start with 1997 is somewhat arbitrary -- we simply chose to use the round number of 30 minimum years in our training data (i.e. 1967 - 1996), since any statistical model needs a decent amount of data to "warm up" or "burn in".
We got all the data from baseball-reference.com. Big thanks to them for their always-fantastic website.
The first model we fit uses a player's basic career statistics to predict his first-year voting percentage, and for subsequent years, we simply predict that a player will receive the same voting percentage as he did in his previous year on the ballot. This model is meant as a baseline model, which we'll subsequently improve.
The career statistics we used were:
For batters:
For pitchers:
In this basic model we also include dummy variables for the player's position (if he is not a pitcher).
We fit a logistic regression model, where the model says that log(p/(1-p)) = B0 + B1*X1 + B2*X2 + ... + Bk*Xk. Here, p is the percentage of ballots on which the player is selected, X1, X2, ... are the career statistics, or predictor variables, for each player, and B0, B1, ... are the regression coefficients, or linear weights, that we are estimating from the training data. The point is to learn from historical training data what values of B0, B1, ... give the most accurate predictions of p.
When we fit this model to the data from 1967 - 1996, for batters appearing on the ballot for the first time (there were 255 such batters), we get the following values of B0, B1, etc.:
Coefficients:
             Estimate Std. Error z value Pr(>|z|)
(Intercept)  -4.95312    0.05827 -84.996  < 2e-16 ***
Yrs           0.50696    0.05896   8.598  < 2e-16 ***
G             1.02431    0.19498   5.253 1.49e-07 ***
AB           -3.63895    0.48980  -7.429 1.09e-13 ***
R             2.27816    0.14227  16.013  < 2e-16 ***
H             3.09533    0.51513   6.009 1.87e-09 ***
HR            1.02926    0.11611   8.865  < 2e-16 ***
RBI          -0.96697    0.11938  -8.100 5.50e-16 ***
SB            0.05453    0.02300   2.371   0.0178 *
BB            0.11799    0.10957   1.077   0.2815
BA            0.36159    0.14988   2.412   0.0158 *
OBP          -0.87513    0.12851  -6.810 9.78e-12 ***
SLG           0.66669    0.12251   5.442 5.27e-08 ***
posC          1.23683    0.08341  14.828  < 2e-16 ***
pos1B         0.62899    0.08654   7.268 3.64e-13 ***
pos2B         0.69801    0.07840   8.904  < 2e-16 ***
pos3B         0.54605    0.07734   7.060 1.66e-12 ***
posSS         0.98028    0.07682  12.760  < 2e-16 ***
posLF         0.40758    0.08835   4.613 3.97e-06 ***
posCF        -0.01913    0.08635  -0.222   0.8246
posRF         0.49642    0.08292   5.987 2.14e-09 ***
---
Signif. codes:  0 ‘***’ 0.001 ‘**’ 0.01 ‘*’ 0.05 ‘.’ 0.1 ‘ ’ 1
The values in the column labeled "Estimate" are the values of B0, B1, ... that explained the training data the best. Don't worry about interpreting their values -- it's hard, given that it's a logistic regression model, and that we scaled the input variables to have a mean of zero and an sd of 1, and that the predictor variables are highly collinear. For now here are three observations:
Now that we have fit this model to all batters who made their first appearance on the ballot between 1967 - 1996, we use the model to make predictions for 1997. In 1997, there were 6 batters on the ballot for the first time: Dave Parker, Dwight Evans, Ken Griffey Sr., Garry Templeton, Terry Kennedy, and Terry Puhl. Our predicted voting percentages for these 6 batters, based on their career statistics and the model we just fit, are in the table below, next to the actual voting percentage for each one.
             Name Prediction Actual
1     Dave Parker       39.4   17.5
2    Dwight Evans       51.8    5.9
3     Ken Griffey       12.7    4.7
4 Garry Templeton        5.3    0.4
5   Terry Kennedy        0.5    0.2
6      Terry Puhl        0.2    0.2
These predictions were pretty bad -- the model was off by about 22% for Dave Parker, and by about 45% for Dwight Evans! The model seemed to overestimate almost everybody's percentage. Perhaps for some reason these 6 players had relatively impressive career statistics, but were not popular with writers, or were not considered great players relative to their peers, for some reason other than their statistics.
The RMSE for these 6 predictions is:
RMSE = sqrt((0.394 - 0.175)^2 + (0.518 - 0.059)^2 + ... + (0.002 - 0.002)^2)
     = 0.211,
or 21.1%. That's pretty bad. If we don't use any variables at all (and just guess the mean voting percentage for everyone, 10%), we have a baseline RMSE of about 25%. So reducing it to 21.1% is better than nothing, but we can do better. (And of course, this is only for a tiny subset of 6 players).
We fit the baseline model for pitchers appearing on the ballot for the first time, also (based on their career pitching statistics). And in this baseline model, as mentioned before, for returning players on the ballot, we simply use their previous year's voting percentage as their current prediction.
When we fit the baseline model and make one-year-ahead predictions for each year from 1997 - 2013, we make a total of 498 predictions (about 29 per year). The overall RMSE of these predictions is 11.7%. (which means that the six predictions illustrated above were less accurate than average). This is our baseline RMSE.
Let's pause to make our first prediction for the 2014 class. According to the baseline model, the 36 players on the ballot this year will receive the following voting percentages:
              Name Previous Predicted
1     Craig Biggio     68.2      68.2
2      Jack Morris     67.7      67.7
3     Frank Thomas      0.0      64.7
4     Jeff Bagwell     59.6      59.6
5      Mike Piazza     57.8      57.8
6       Tim Raines     52.2      52.2
7        Lee Smith     47.8      47.8
8   Curt Schilling     38.8      38.8
9        Jeff Kent      0.0      38.7
10   Roger Clemens     37.6      37.6
11     Greg Maddux      0.0      37.5
12     Barry Bonds     36.2      36.2
13  Edgar Martinez     35.9      35.9
14   Alan Trammell     33.6      33.6
15   Luis Gonzalez      0.0      23.0
16    Larry Walker     21.6      21.6
17    Fred McGriff     20.7      20.7
18    Mark McGwire     16.9      16.9
19    Mike Mussina      0.0      16.3
20     Tom Glavine      0.0      15.1
21   Don Mattingly     13.2      13.2
22      Sammy Sosa     12.5      12.5
23     Moises Alou      0.0      10.5
24 Rafael Palmeiro      8.8       8.8
25      Ray Durham      0.0       7.1
26 Armando Benitez      0.0       3.3
27      Sean Casey      0.0       0.9
28      Eric Gagne      0.0       0.8
29   Richie Sexson      0.0       0.6
30    Paul Lo Duca      0.0       0.5
31    Kenny Rogers      0.0       0.4
32       J.T. Snow      0.0       0.4
33      Hideo Nomo      0.0       0.2
34     Mike Timlin      0.0       0.1
35    Jacque Jones      0.0       0.1
36      Todd Jones      0.0       0.1
Wow! Those are some incredibly low predictions for first-time pitchers Greg Maddux and Tom Glavine. Most experts think that Maddux will get above 90% of the vote, and Glavine is a borderline first-ballot Hall-of-Famer. It's possible that Maddux's career numbers simply don't capture what a dominant pitcher he was throughout his career compared to his peers. Hopefully we'll see this prediction rise a lot using the next few models. (Hint: we will, because of a little lurking variable called 'Steroids').
To investigate which variables we should add to the next model, it's helpful to analyze the residuals from this model, where the residual is defined as the observed voting percentage - the predicted voting percentage. In particular, let's see which players had the highest residuals (they received a much higher voting percentage than we predicted), and which players had the lowest residuals (they received a much lower voting percentage than we predicted).
First, the highest residuals:
  Year           Name Actual Predicted Residual
1 2002    Ozzie Smith   91.7       9.3     82.4
2 2001  Kirby Puckett   82.1       2.8     79.3
3 2005     Wade Boggs   91.9      57.1     34.8
4 2004   Paul Molitor   85.2      56.0     29.2
5 2010 Edgar Martinez   36.2       7.6     28.6
I see two predictors that should improve the predictions for Ozzie Smith and Kirby Puckett: All-Star games and Gold Gloves. Both of these players were popular (i.e. they went to lots of All-Star games), and were excellent fielders (so they won lots of Gold Glove awards). Including these variables for all players as additional predictors should increase our predicted voting percentages for Smith and Puckett, thereby decreasing their residuals and lowering the overall RMSE.
What about the lowest residuals from the baseline model?
  Year            Name Actual Predicted Residual
1 2011 Rafael Palmeiro   11.0      93.8    -82.8
2 2013     Barry Bonds   36.2      99.5    -63.3
3 2013   Roger Clemens   37.6      99.5    -61.9
4 2010    Fred McGriff   21.5      73.9    -52.4
5 2013    Julio Franco    1.1      52.3    -51.3
A-ha. There is an obvious variable that will improve the predictions for the 3 players with the smallest residuals, too: association with steroids. If there is an objective variable measuring association with the steroid 'scandal' in baseball, it should help immensely. Fortunately, there are two such variables:
We'll incorportate All-Star appearances, Gold Gloves, and association with the steroid scandal in our next model.
Last, we also note here that the average residual among the 262 voting percentage predictions in which a player had already appeared on at least one ballot was +1.8%. In other words, on average, a player's vote percentage goes up on subsequent ballots. This is fairly obvious from looking at the interactive viz. What it means is that we can also improve our predictions by fitting a more complicated model for returning players. We'll get to that a bit later.
To incorporate Al-Star appearances, we compute the percentage of years of each player's career that he was invited to the All-Star Game (it doesn't matter if he actually played in the game -- just whether he was on the roster). We also collected the number of Gold Glove Awards for each player, which is an award given to one player at each position in each league each year for excellent fielding. Note that Greg Maddux is the all-time leader in MLB with 18 gold gloves (for being the best-fielding pitcher in his league).
We coded association with the steroid scandal as an indicator variable that we'll call 'drugs' where a player has a value of 1 if he was either named in the Mitchell Report or was suspended by MLB for a failed drug test, and a value of 0 otherwise.
The coefficients of the new model for batters, for example, using data from 1967 - 2013, are:
Coefficients:
                   Estimate Std. Error  z value Pr(>|z|)
(Intercept)        -5.06138    0.04105 -123.297  < 2e-16 ***
Yrs                 0.45710    0.03482   13.126  < 2e-16 ***
G                   0.04866    0.14206    0.343 0.731956
AB                  1.19086    0.35348    3.369 0.000754 ***
R                   0.77139    0.08730    8.836  < 2e-16 ***
H                  -0.45408    0.33854   -1.341 0.179833
HR                  0.23529    0.07811    3.012 0.002591 **
RBI                -0.25770    0.07589   -3.396 0.000684 ***
SB                  0.05966    0.01925    3.098 0.001946 **
BB                  0.19763    0.07434    2.659 0.007845 **
BA                  0.70028    0.09827    7.126 1.03e-12 ***
OBP                -0.34327    0.09171   -3.743 0.000182 ***
SLG                 0.44575    0.08467    5.265 1.40e-07 ***
posC                0.15344    0.02416    6.350 2.15e-10 ***
pos1B               0.12146    0.02199    5.522 3.35e-08 ***
pos2B              -0.11253    0.02412   -4.665 3.09e-06 ***
pos3B              -0.05740    0.02361   -2.431 0.015062 *
posSS               0.10689    0.02300    4.646 3.38e-06 ***
posLF               0.03259    0.02365    1.378 0.168104
posCF              -0.20443    0.02516   -8.127 4.40e-16 ***
posRF              -0.17330    0.02406   -7.203 5.89e-13 ***
drugs              -0.91575    0.02574  -35.583  < 2e-16 ***
AllStarpy           1.12870    0.01691   66.752  < 2e-16 ***
gold.gloves         0.20908    0.01136   18.411  < 2e-16 ***
---
Signif. codes:  0 ‘***’ 0.001 ‘**’ 0.01 ‘*’ 0.05 ‘.’ 0.1 ‘ ’ 1
As you can see, the new variables are all highly statistically significant, and their signs are just as we would expect: association with steroids decreases one's voting percentage, and All-Star appearances and gold gloves increase it. The new overall RMSE is 10.0%, down from 11.7% -- a nice improvement.
The predictions for first-ballot players in 2014 also seem to have improved (at least according to our personal expectations). Greg Maddux suddenly has a very high predicted percentage, for example. This is because Roger Clemens is no longer de-valuing great career statistics, since 'drugs' now explains a large part of his low first-year voting percentage.
              Name Previous Predicted
1      Greg Maddux        0      96.0
2     Frank Thomas        0      59.5
3     Mike Mussina        0      57.7
4      Tom Glavine        0      50.5
5    Luis Gonzalez        0      20.9
6      Moises Alou        0      13.1
7        Jeff Kent        0      11.0
8     Kenny Rogers        0       2.5
9  Armando Benitez        0       1.7
10      Ray Durham        0       1.1
11      Sean Casey        0       0.6
12   Richie Sexson        0       0.3
13       J.T. Snow        0       0.3
14      Todd Jones        0       0.3
15      Hideo Nomo        0       0.2
16     Mike Timlin        0       0.2
17    Paul Lo Duca        0       0.0
18    Jacque Jones        0       0.0
19      Eric Gagne        0       0.0
The largest and smallest residuals are a little different now, but they contain some of the same players as before:
Largest 5 residuals:
  Year          Name Actual Predicted Residual
1 2001 Kirby Puckett   82.1      12.0     70.1
2 1999   Robin Yount   77.5       8.6     68.9
3 1999  George Brett   98.2      54.3     43.9
4 2004  Paul Molitor   85.2      50.3     34.9
5 2005    Wade Boggs   91.9      60.4     31.4
Smallest 5 residuals:
  Year          Name Actual Predicted Residual
1 2013   Barry Bonds   36.2      99.3    -63.1
2 2013 Roger Clemens   37.6      97.9    -60.3
3 2008    Tim Raines   24.3      81.7    -57.4
4 2007  Jose Canseco    1.1      38.6    -37.5
5 2007  Mark McGwire   23.5      58.7    -35.2
You'll notice that the smallest residuals still contain Bonds and Clemens (and Jose Canseco and Mark McGwire, two other steroid-scandal players). This is unfortunate, but it's not a mistake in the modeling: Remember, these residuals are from one-year-ahead predictions, or what are known as "out-of-sample" predictions.
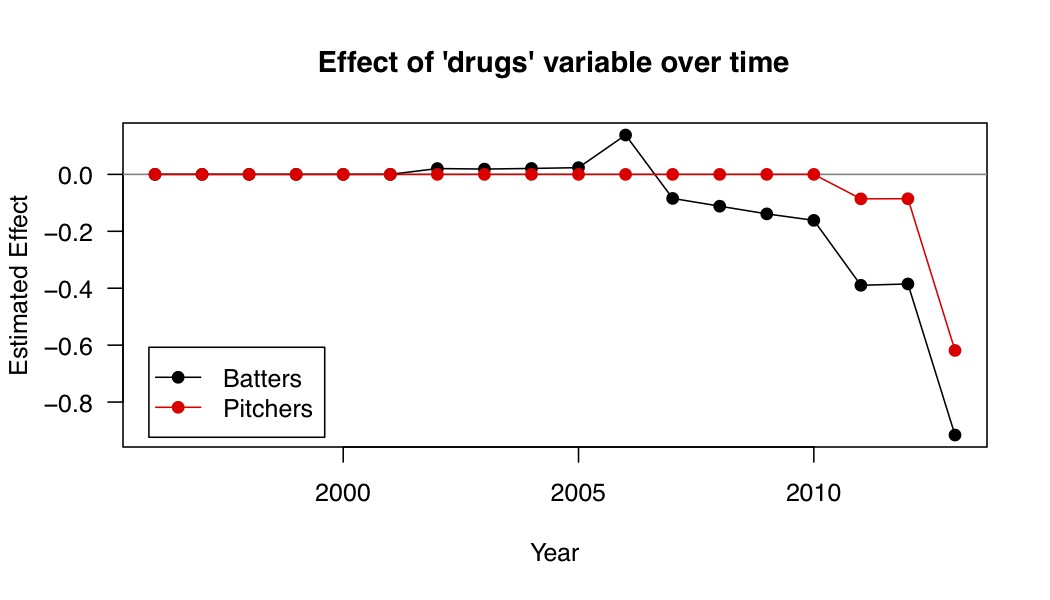
One problem with the 'drugs' variable is that the players associated with the steroids scandal have had better career statistics as the years have progressed. For example, Jose Canseco, who was named in the Mitchell Report, appeared on the HOF ballot for the first time in 2007. His career statistics weren't that great, so the estimated 'drugs' effect was not very large (it was -0.07 after Canseco's results were included in the model). Then Rafael Palmeiro appeared on the ballot in 2011, and his career statistics were much better than Canseco's, so the estimated 'drugs' effect was much larger than before (to account for Palmeiro's low first-year voting percentage of 11%). The 'drugs' effect dropped to -0.27 after his voting percentage was included in the model. But Roger Clemens and Barry Bonds have fantastic career statistics, and they didn't appear on the ballot until 2013. So it was only after the 2013 voting results were released that we truly learned how large the 'drugs' effect was, when Roger Clemens and Barry Bonds were selected on only 36% of ballots in their first year (even though their career statistics are comparable to players who received 99% of the vote in their first year). For batters, the 'drugs' effect dropped from about -0.27 to -0.96 after 2013 was included in the training data, and for pitchers it dropped from about -0.05 to -0.54 after 2013 was included. One would hope that by now, we have observed the full range of career statistics among steroid-tainted players, and our model has accurately captured its effect. But of course only time will tell...
Here is a plot of the estimated 'drugs' effect by year for batters and pitchers:
Anyways, turning to the positive residuals: one interesting thing that Puckett, Yount, and Brett have in common is that they all played for just one team during their careers. Also, 4 of these 5 players had 3000 career hits, which is thought of as a major milestone that qualifies a player for the Hall of Fame. Last, Robin Yount is a 2-time MVP Award winner, so if we incorporate this variabe, hopefully his prediction will become more accurate.
In this model, we include several more variables:
With this model, the overall RMSE decreased a little, from 10.0% to 9.5%. And here are our updated predictions for 2014:
              Name Previous Predicted
1      Greg Maddux        0      96.7
2     Frank Thomas        0      56.1
3      Tom Glavine        0      50.5
4     Mike Mussina        0      41.6
5      Moises Alou        0       8.8
6    Luis Gonzalez        0       7.3
7        Jeff Kent        0       6.2
8     Kenny Rogers        0       2.4
9       Sean Casey        0       1.6
10 Armando Benitez        0       1.4
11      Ray Durham        0       0.7
12       J.T. Snow        0       0.4
13      Todd Jones        0       0.3
14      Hideo Nomo        0       0.2
15   Richie Sexson        0       0.2
16     Mike Timlin        0       0.2
17    Paul Lo Duca        0       0.0
18    Jacque Jones        0       0.0
19      Eric Gagne        0       0.0
Maddux is still predicted to be a lock. And the rest of the first-time ballot players decreased by a bit. The residual plot still shows some large positive and negative residuals, but we're running out of variable to include here. For now, we'll stick with this model for first-ballot batters and pitchers, and in the final improvement, we'll focus on returning ballot players.
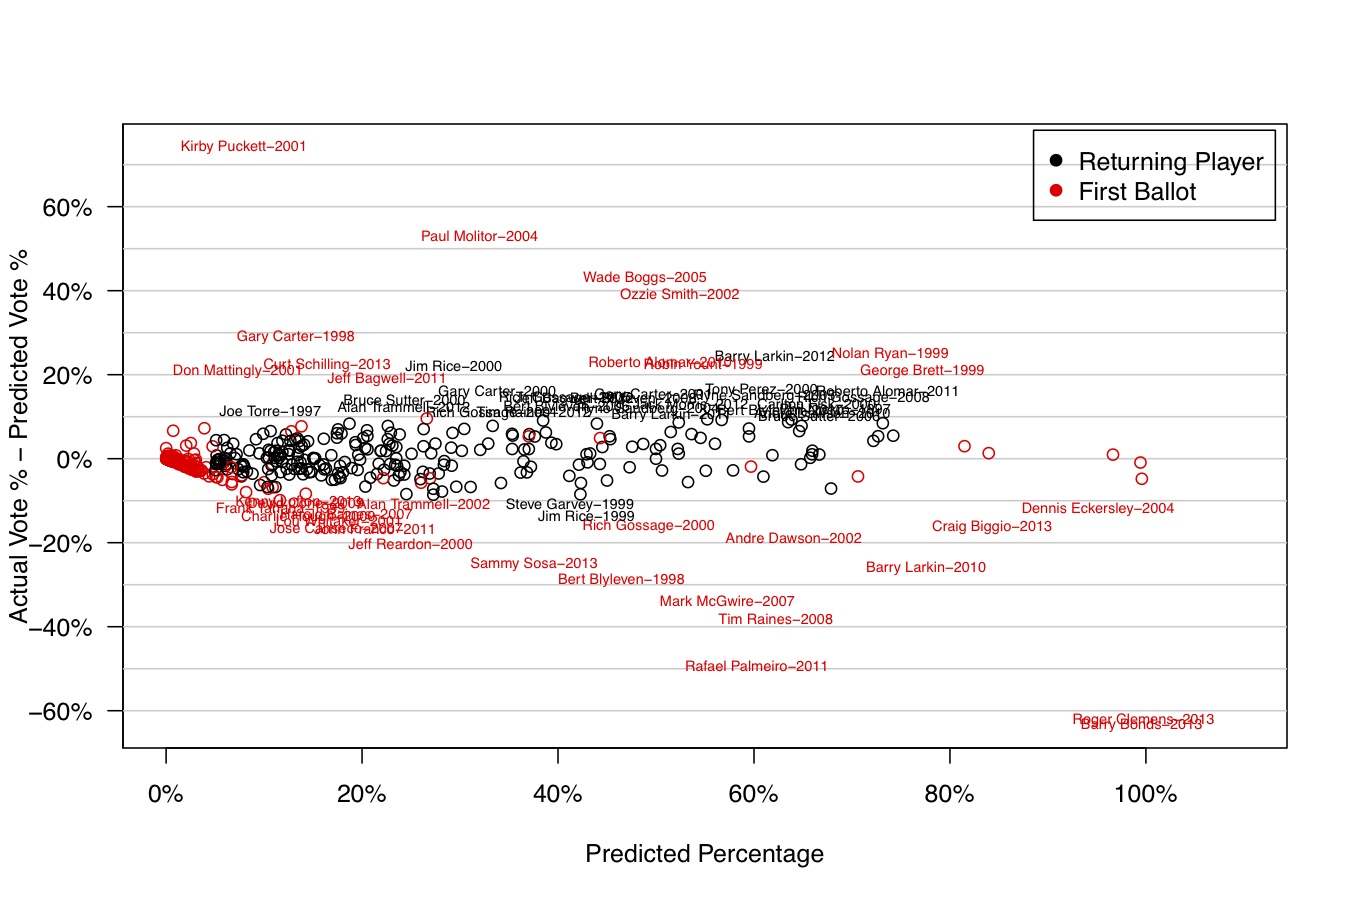
Below is the full residual plot. The plot is very crowded, but you can pick out the large positive and negative residuals. Recall that these are out-of-sample residuals from one-year-ahead predictions. There may simply be no way to have predicted Puckett's high voting percentage ahead of time, or Bonds and Clemens low voting percentages using only quantitative data from previous years. We're OK with that - there may always be some players that can't be predicted using only quantitative methods.
For Model 3, the RMSE can be broken down into three groups:
We'll focus on the third group now, by trying to come up with a better model for returning players. So far we have simply predicted that they will receive the same voting percentage as their previous year on the ballot. But on average, we know that voting percentages increase by about 1.8% each year.
We'll use the same basic tool, a regression model, to improve these predictions. For a given player appearing on his 2nd ballot or later, consider the following predictor variables:
When we include these variables in a regression model on historical data to predict the current year's returning players' voting percentages, we get estimates that make sense:
Coefficients:
                               Estimate Std. Error  z value Pr(>|z|)
(Intercept)                   -1.105059   0.004819 -229.318  < 2e-16 ***
previous.year                  1.459227   0.019041   76.638  < 2e-16 ***
previous.year.squared         -0.423280   0.018057  -23.442  < 2e-16 ***
top3.firstballot              -0.172855   0.004484  -38.551  < 2e-16 ***
top5.returnballot             -0.017089   0.004655   -3.671 0.000242 ***
second.ballot                 -0.065219   0.009202   -7.088 1.36e-12 ***
final.ballot                   0.028051   0.004372    6.416 1.40e-10 ***
second.ballot.x.previous.year  0.078301   0.008239    9.504  < 2e-16 ***
---
Signif. codes:  0 ‘***’ 0.001 ‘**’ 0.01 ‘*’ 0.05 ‘.’ 0.1 ‘ ’ 1
As we expected the coefficients for "Top 3 First Ballot" and "Top 5 Returning Ballot" were negative -- these account for the "crowded ballot" effect. And there was a very strong association between the previous year's voting percentage and the current year's voting percentage. Also there was a positive bump for a player's final year on the ballot, and a positive effect of the interaction between a player's second year on the ballot and his previous year's voting percentage.
When we fit this model and make one-year-ahead predictions from 1997 - 2013, we find that the RMSE for returning players decreases from 6.0% to 4.7%. Interestingly, we were still unable to predict the 1999 ballot very well, because prior to 1999, we had little data to inform us of what would happen when three or more players appeared on the ballot for the first time with very high expected voting percentages. So we still have some low residuals (overpredictions) for returning players in 1999, such as Jim Rice, Steve Garvey, Tony Perez, and Gary Carter.
Under Model 4, the overall one-year-ahead RMSE decrease from 9.5% to 9.1%, and the predictions for 2014 are below. Maddux is still a lock, but now Craig Biggio is right on the edge, with a prediction of 74.6%.
              Name Previous Predicted
1      Greg Maddux      0.0      96.7
2     Craig Biggio     68.2      74.6
3      Jack Morris     67.7      71.2
4      Mike Piazza     57.8      64.8
5     Jeff Bagwell     59.6      61.6
6     Frank Thomas      0.0      56.1
7       Tim Raines     52.2      54.0
8      Tom Glavine      0.0      50.5
9        Lee Smith     47.8      48.9
10    Mike Mussina      0.0      41.6
11  Curt Schilling     38.8      39.7
12   Roger Clemens     37.6      37.9
13     Barry Bonds     36.2      35.9
14  Edgar Martinez     35.9      34.2
15   Alan Trammell     33.6      31.4
16    Larry Walker     21.6      18.3
17    Fred McGriff     20.7      17.4
18    Mark McGwire     16.9      14.1
19   Don Mattingly     13.2      11.3
20      Sammy Sosa     12.5       9.8
21     Moises Alou      0.0       8.8
22 Rafael Palmeiro      8.8       8.6
23   Luis Gonzalez      0.0       7.3
24       Jeff Kent      0.0       6.2
25    Kenny Rogers      0.0       2.4
26      Sean Casey      0.0       1.6
27 Armando Benitez      0.0       1.4
28      Ray Durham      0.0       0.7
29       J.T. Snow      0.0       0.4
30      Todd Jones      0.0       0.3
31      Hideo Nomo      0.0       0.2
32   Richie Sexson      0.0       0.2
33     Mike Timlin      0.0       0.2
34    Paul Lo Duca      0.0       0.0
35    Jacque Jones      0.0       0.0
36      Eric Gagne      0.0       0.0
We've just about run out of variables to add to the model. It would be nice to have a measure of postseason success (total playoff games played, or number of world series won?), or a more detailed breakdown of MVP voting over one's career (such as number of top-10 MVP finishes), but we're not going to bother gathering those stats for now.
We'll just make one final adjustment: This is borderline cheating, but I just don't like Frank Thomas having such a low prediction (56%), and I think part of it is due to Barry Bonds being a great slugger and getting a low first ballot voting percentage in 2013. Even though we have the 'drugs' variable (which is 1 for Bonds, and 0 for Thomas, and should account for much of Bonds' low voting percentage), I think the inclusion of Bonds's 2013 voting percentage has de-valued slugging statistics. The same might also be true for Clemens and pitching statistics. So I removed these two data points and re-fit the model, and as expected, Thomas's prediction increased.
By removing Bonds and Clemens 2013 data, Frank Thomas's 2014 prediction increased from 56% to about 64%, which seems like a move in the right direction. Here are the final predictions for all 36 players on the 2014 ballot (same as the table at the top of this page):
              Name Previous Predicted
1      Greg Maddux      0.0      97.4
2     Craig Biggio     68.2      74.2
3      Jack Morris     67.7      70.8
4      Mike Piazza     57.8      64.3
5     Frank Thomas      0.0      64.1
6     Jeff Bagwell     59.6      61.0
7      Tom Glavine      0.0      53.5
8       Tim Raines     52.2      53.4
9        Lee Smith     47.8      48.4
10    Mike Mussina      0.0      42.4
11  Curt Schilling     38.8      39.2
12   Roger Clemens     37.6      37.4
13     Barry Bonds     36.2      35.4
14  Edgar Martinez     35.9      33.7
15   Alan Trammell     33.6      30.9
16    Larry Walker     21.6      17.9
17    Fred McGriff     20.7      17.1
18    Mark McGwire     16.9      13.8
19   Don Mattingly     13.2      11.1
20      Sammy Sosa     12.5       9.6
21   Luis Gonzalez      0.0       9.5
22     Moises Alou      0.0       8.8
23 Rafael Palmeiro      8.8       8.4
24       Jeff Kent      0.0       5.2
25    Kenny Rogers      0.0       2.5
26 Armando Benitez      0.0       1.4
27      Sean Casey      0.0       1.0
28      Ray Durham      0.0       0.6
29      Eric Gagne      0.0       0.3
30       J.T. Snow      0.0       0.3
31      Todd Jones      0.0       0.3
32      Hideo Nomo      0.0       0.2
33   Richie Sexson      0.0       0.2
34     Mike Timlin      0.0       0.2
35    Paul Lo Duca      0.0       0.1
36    Jacque Jones      0.0       0.1
A few final thoughts:
Thanks to Carson Sievert, Carlos Scheidegger, and Chris Volinsky for help with code, visualization, and model suggestions.
Kenny Shirley